This quick HOWTO is a PowerShell script I wrote to monitor concurrent connections to a server. In this case we have a domain controller that is not behaving properly and I suspect it may be due to some kind of port exhaustion. The script is very quick and dirty but since it works I figured I’d share it. Note that the heavy lifting is done by TCPVCON.EXE from Sysinternals (http://technet.microsoft.com/en-ca/sysinternals/bb897437.aspx). I also include the current CPU utilization so I can correlate if during periods of high CPU if we are seeing an unusually high connection count.
# Grabs a count of the current network connections to a server and appends the results to a CSV file
# TCP; Connections; CSV

$objConnections = @();
$PathToExe = "c:\bin\PStools\Tcpvcon.exe"
$PathToExportCSV = "c:\temp\connectioncount.txt"

Function Wait-RVCountdown
{
    $MinutesToWait = 1
    $TimeToWait = $MinutesToWait*60
    $length = $TimeToWait / 100
    while($TimeToWait -gt 0)
    {
        $min = [int](([string]($TimeToWait/60)).split('.')[0])
        $text = " " + $min + " minutes " + ($TimeToWait % 60) + " seconds left"
        Write-Progress "Waiting for next log check..." -status $text -PercentComplete ($TimeToWait/$length)
        start-sleep -s 1
        $TimeToWait--
    }
}

Function Add-ToObject{
	$Script:objConnections += New-Object PSObject -Property @{ Date = $args[0]; Connections = $args[1]; CPUUsage = $args[2]; }
}

While(1 -eq 1)
{
    $Connections = & $PathToExe -n -c 2> $null
    Add-ToObject (Get-Date) $Connections.Count
    $proc =get-counter -Counter "\Processor(_Total)\% Processor Time" -SampleInterval 2
    $CPUUsage =[math]::Round(($proc.readings -split ":")[-1])

    $objConnections | Select Date, Connections, $CPUUsage | Export-CSV -NoTypeInformation $PathToExportCSV
	Wait-RVCountdown
}
The results look like this:
“Date”,”Connections”,”CPUUsage”
“10/20/2014 10:54:58 AM”,”1344″, “23”
“10/20/2014 10:56:00 AM”,”1390″, “42”
“10/20/2014 10:57:02 AM”,”1427″, “25”
“10/20/2014 10:58:04 AM”,”1437″, “21”
“10/20/2014 10:59:14 AM”,”1455″, “41”
“10/20/2014 11:00:33 AM”,”1465″, “45”
“10/20/2014 11:01:57 AM”,”1543″, “31”
“10/20/2014 11:03:20 AM”,”1570″, “22”
…
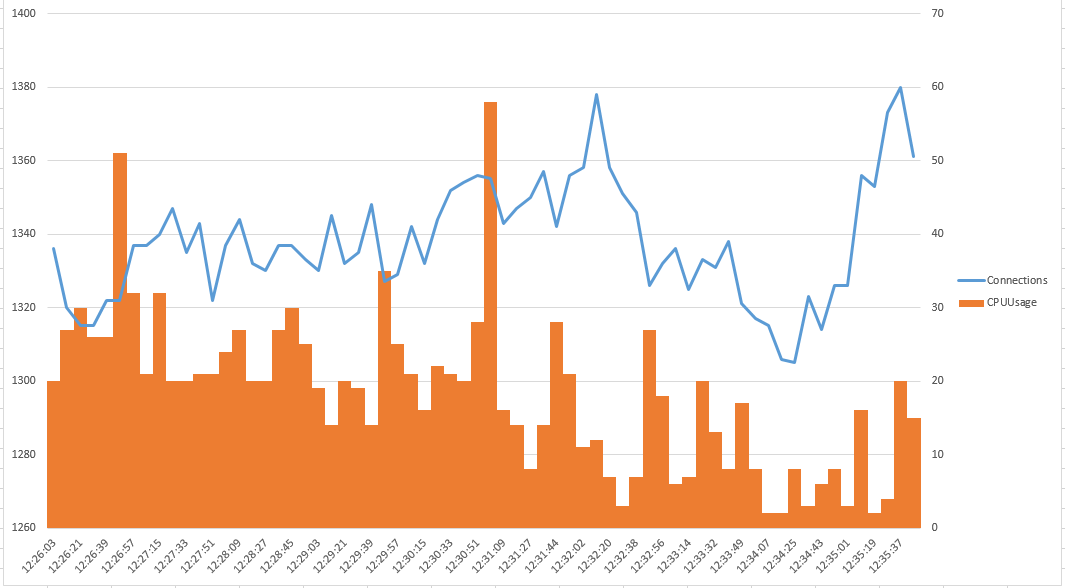
You can then import the results into Excel to get charts like this: