Have you ever found one of your domain controllers pinned at 100% CPU with lsass.exe using up 99% of it? Have you been baffled at how to figure out what to do next and how to figure out who and what is causing it? Thankfully Microsoft has created a tool to help aid us in our troubleshooting. I’ve found however that there is remarkably little documentation online for this tool so hopefully this document will help those that are trying to get this tool working.
This HOWTO describes how to use a downloadable tool called the Server Performance Advisor (SPA) to troubleshoot situations where a Windows domain controller is experiencing high CPU utilization.
The SPA tool is a free download from Microsoft and can be downloaded here:
http://download.microsoft.com/download/0/3/D/03D07D11-18D4-4160-B4AC-915061B85669/SPAPlus_amd64.cab
(At the time of this writing, the most recent version is v3.1)
Please note that this tool requires a SQL Server to function. Fortunately, the free Express edition will work. In my case I used SQL 2008 R2. You can grab that here:
http://www.microsoft.com/en-ca/download/details.aspx?id=23650
SQL Server Installation
For this use case, I will install SQL server on my laptop. You could also use an existing SQL server if you have one or build a new VM.
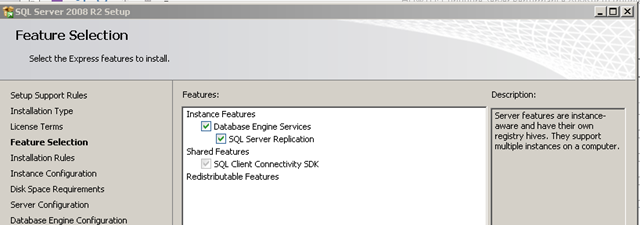
- When you run the installer, select New installation or add features to an existing installation
- Select all checkboxes. (Note: If you used a download that includes the management tools, be sure to include those as well)
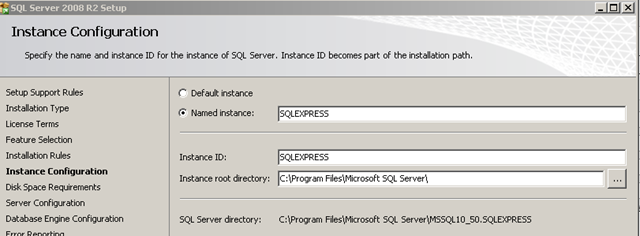
- Leave the default which should be to create a Named Instance called SQLEXPRESS
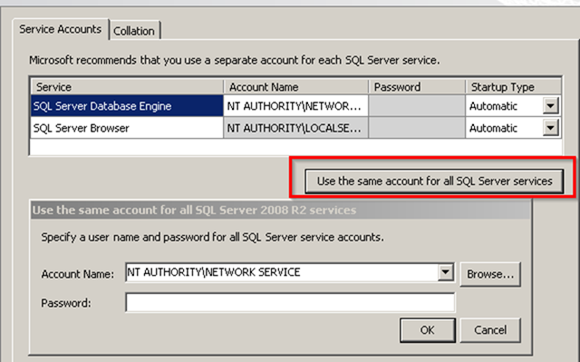
- For the service accounts, select Use the same account for all SQL Server services and select NT AUTHORITY\NETWORK SERVICE. You do not need to provide a password
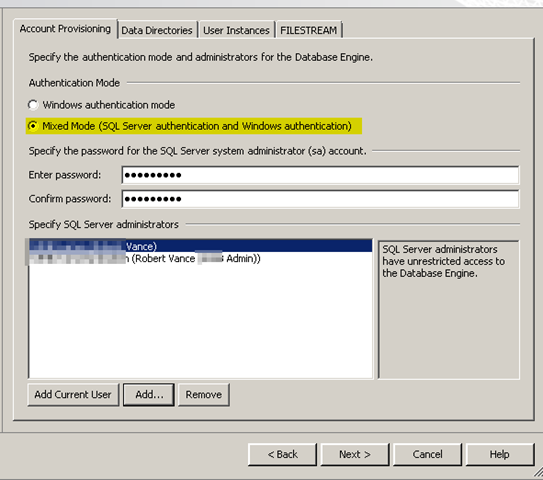
- Important: You need to ensure that the SQL Server Administrator includes the account you will use to run the SPA tool. This account must be an administrator on the domain controller in question
- If you don’t include this, the SPA tool will give a generic error about being unable to connect to the database server during the setup phase
- I also recommend using mixed mode with a dedicated sa account so you can ensure you can log in
- Once the installation is complete, the database server by default will not allow external connections. To fix this, run the SQL Server Configuration Manager from the start menu
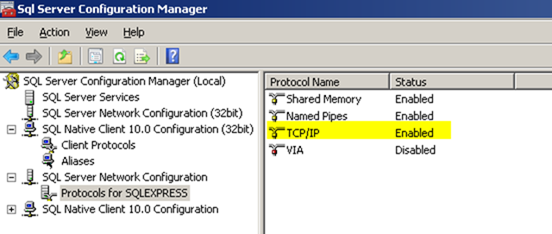
- Expand SQL Server Network Configuration and choose Protocols for SQLEXPRESS. By default TCP/IP will be disabled. Right click and choose Enable
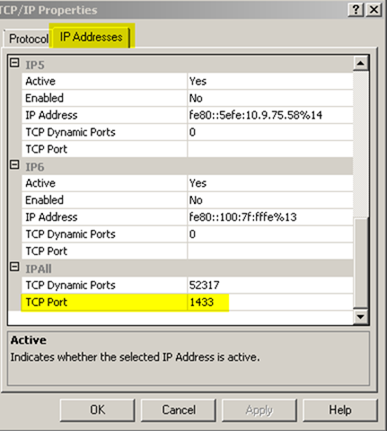
- Right click on TCP/IP and choose properties
- Select the IP Addresses tab and scroll to the very bottom under IPAll. The TCP Port field will be blank. Fill in the default SQL port of 1433
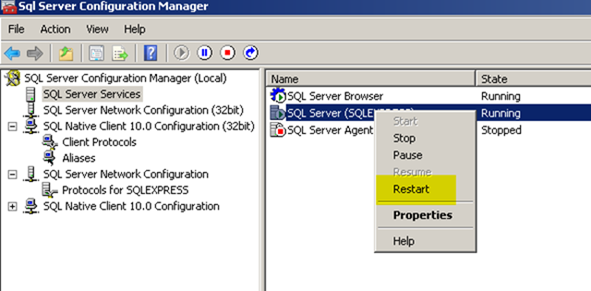
- You now need to restart the SQLEXPRESS instance service for the change to take effect
- Congratulations, your SQL server is now setup and ready to be used
Server Performance Advisor Configuration
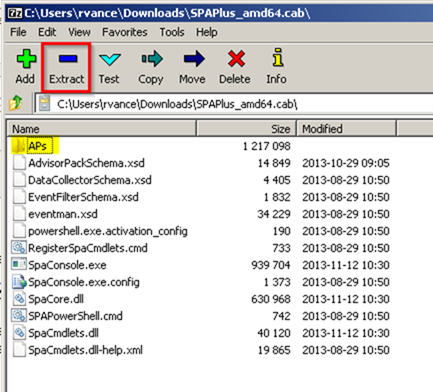
The first thing to be aware of is that this is not a traditional installable application. Rather the file you download is a .cab file. The file also contains required subdirectories that you must take special care to extract. You have two options here.
- First you can use the built in extrac32 command by using the following syntax: extrac32.exe /e /a /l c:\SPA c:\temp\SPAPlus_amd64.cab
- Note: This means that this application does not require installation and can be placed anywhere. In my case I used D:\SPA on the domain controller.
- Alternatively, you can simply use 7-Zip as it can also read the files and extract them as shown below:
- Double click on SPAConsole.exe to start the application
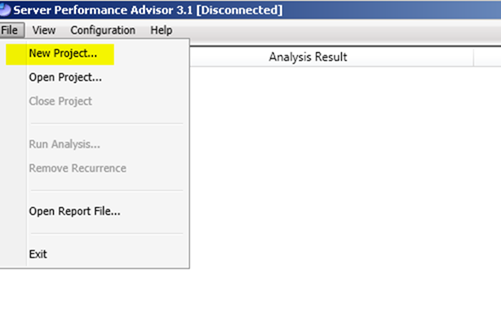
- Select File / New Project
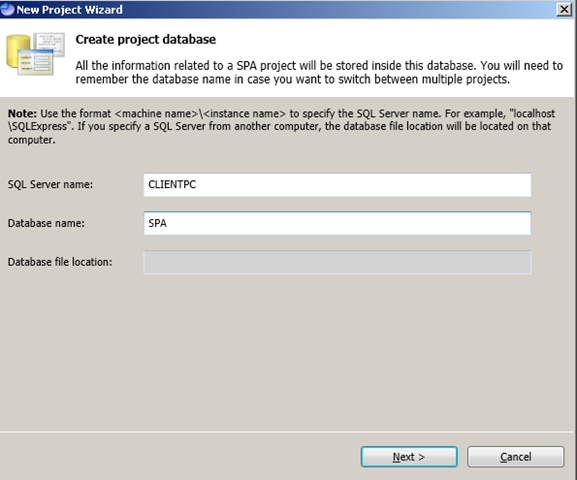
- You’ll be prompted for a SQL Server name. Enter the name hostname of the machine you installed SQL Server on
- The database name will be the new database that will be created for this project.
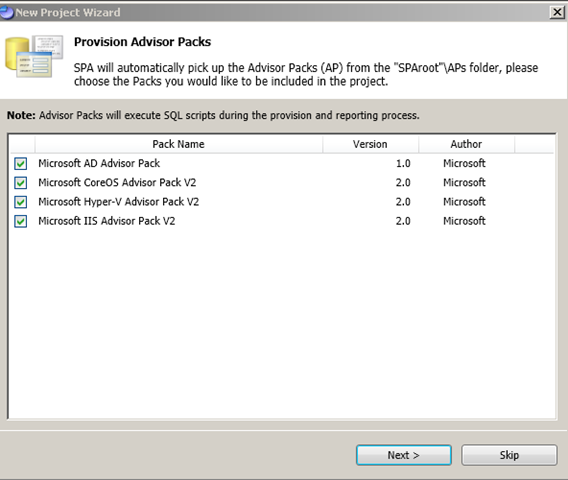
- You’ll then be prompted what “Advisor packs” to include.
- Note: If you didn’t extract the files properly to make the AP sub folder, this will be blank and you cannot proceed. Press Next
- You’ll then be asked for the name of the server you wish to monitor. Since we are running this on the domain controller, we can use localhost
- Note that the tool dumps all of the data into a file share so that it can be then sent to the database server.
- Create a share on the domain controller and and give it both NTFS and Share permissions – Everyone Full Control
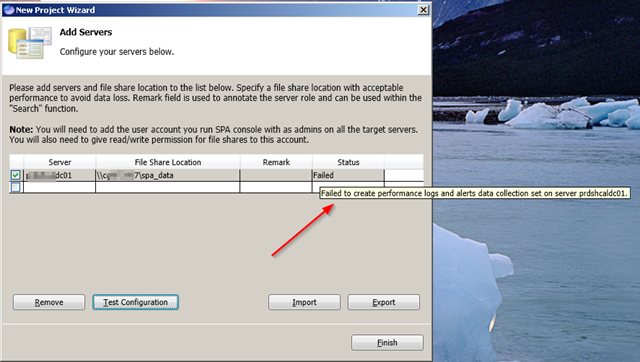
- Warning: This is where I had most of my frustrations however so I wanted to draw your attention to some troubleshooting steps. There is a Test Configuration button. Every time I tried that, it came back as “Failed”
- I eventually realized that if you hover your cursor over the word failed, you’ll get a more detailed error message. The most common I had was “Failed to create performance logs and alerts” and even more commonly “Cannot start performance logs and alerts”
- It turns out there is a log file that is generated called log.txt in the same folder where the spaconsole.exe resides. If we open that after the failure we can get more detail:
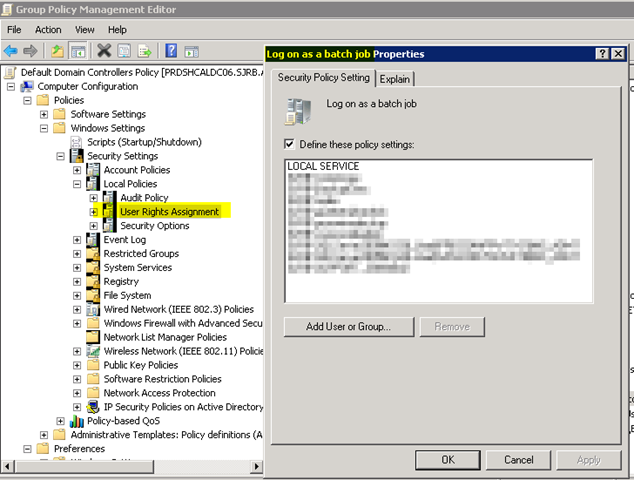
- After much troubleshooting, I ultimately figured out that for this tool to work, the admin account you use to run the tool must also be granted “Log on as a batch job” on the domain controller
- To accomplish this, open up Group Policy Management on your domain controllers and edit the Default Domain Controllers Policy
- Browse to Computer Configuration / Policies / Windows Settings / Security Settings / Local Policies / User Rights Assignment
- Add the admin account you are using to run the tool to this list. If you plan on using this on a regular basis, it is recommended to create a dedicated SPA service account
- Once you have made this change, if you run the test tool again, it should pass
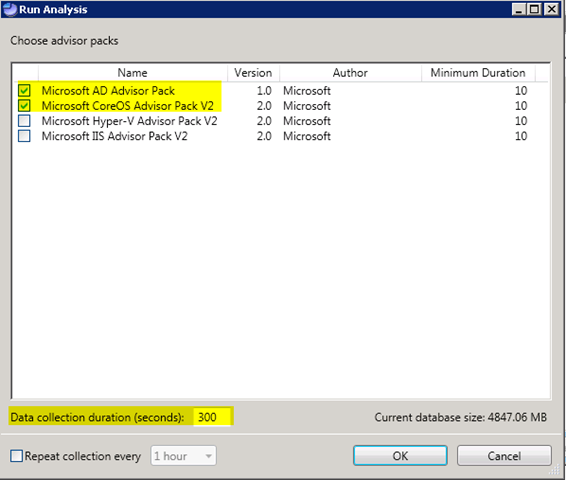
- At this point, you should be able to press Run Analysis from the SPAConsole
- Select the Microsoft AD Advisor Pack and Microsoft CoreOS Advisor Pack V2
- Select the data collection duration. Note: This tool can generate a lot of data. I have captured only 7 minutes or so of data in this screenshot and you can see the database has already grown to almost 5GB.
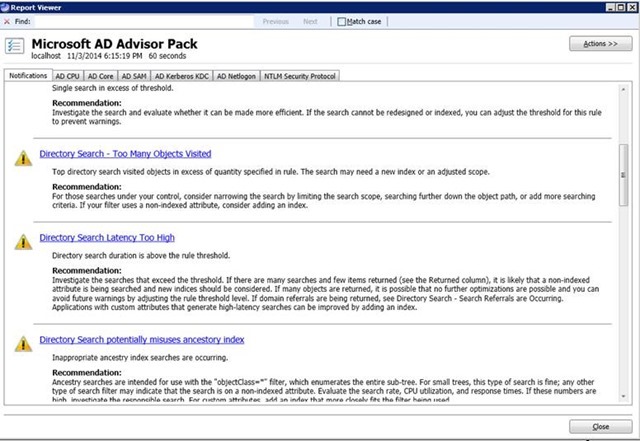
- Once the data collection is complete, choose View / Report Explorer
- The report will have a ton of data available to in addition to some explanations of findings and recommended solutions as shown below:
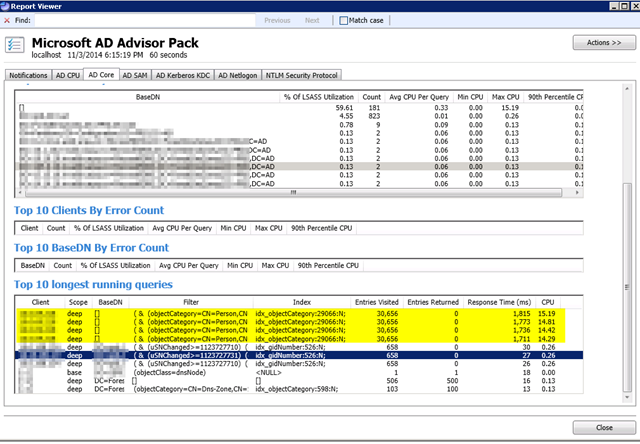
- If you select the AD Core tab, you can get a list of the longest running queries, what specifically is being queried and what machine is making the query. This is useful in isolating specifically who or what is causing your high CPU usage
In this scenario, we discovered that Cisco Jabber clients were querying the ipPhone attribute constantly. We enabled a dedicated index for this attribute which reduced the amount of CPU time required for each lookup and thus dropped the overall utilization on the domain controller.


