This HOWTO describes the process of configuring a Citrix Netscaler to monitor for a keyword on a load balanced website and if that key word is not found (ie the node has failed), remove it. Once removed, continue scanning and once the node is back up, read it.
- The foundational technology we use here is called a “Monitor” which in Citrix parlance is a entity that can be used to repeatedly check some condition against some service
- While you can configure monitors from the GUI, it turns out the GUI adds some random carriage returns that breaks the entire process so you have to do it from the CLI
- So first you want to putty into the Netscaler. Once logged in, you can type “shell” to access the full linux command line. In our case, we don’t want to do that as we are running Netscaler specific commands
- Create a new monitor using the command:
add lb monitor [monitorname] TCP-ECV -send “GET / HTTP/1.1\r\nHost:[hostheadername]\r\nConnection:Close\r\n\r\n” -recv [Keywordtosearchfor] -LRTM ENABLED
-
What this command does is:
- creates a monitor called monitorname and makes it based on the built in template “TCP-ECV”. The arguments provided to the –send parameter tell it what to send to the IP address you’ll configure later. (You can probably configure it on the same line but I don’t know how to do that yet).
- The GET / says get the root page. So in this case, hostheadername doesn’t have an index.html or anything on the end so we can simply request the root page.
- Because we are using host headers, we have to provide the host we are looking to connect to. (This was the hardest part to figure out). You’ll note the line remarks for \r and \n. Those are critical as they must follow the HTTP standard.
- The “connection close” close the connection after you obtained the information you needed so you don’t leave it hanging open.
- Keywordtosearchfor is the string we’re looking for in the results to determine if the page is serving the content you expect or not.
- The LRTM stands for “Least Response Time using Monitoring”. I don’t know what it does but it seems like I need it.
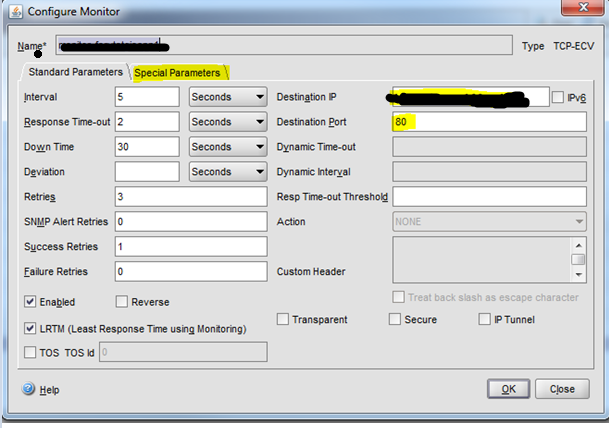
- Once this is created, you can go back into the GUI and select the monitor you created.
- Here you’ll need to fill in the Destination IP and port. (Note that even in production, it will still be port 80 as the web servers aren’t SSL – the load balancer itself is)

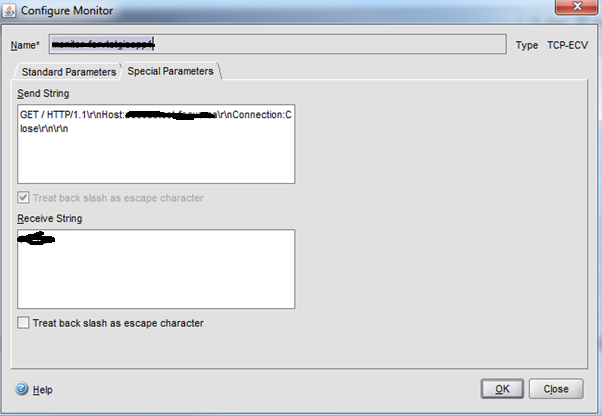
- If you select the Special Parameters tab, you’ll see the information we provided at the command line. Note you can’t simply type the exact same line in here as it’ll add some other crap to the end, breaking it.

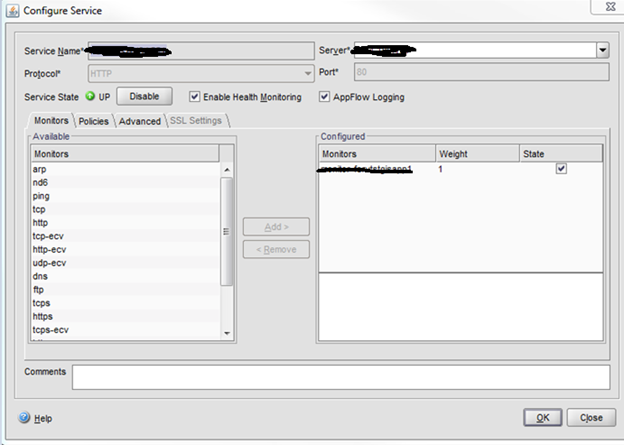
- Now that your monitor is created, you need to bind it to the service. We are going to need one monitor for each service which means for each web server. If you go to the Services section of the Netscaler, you’ll see we already have them.

- Double click on your service to edit it
- In the configured pane, you’ll see the default monitor. Remove it. Scroll down and select the one you made

- Repeat the steps above for the other node
- Note that the TCP services should remain untouched as those are already configured to monitor the state of the net.TCP connection
That should be it. Once these steps are completed in the other environments, should an individual node fail with the “Service unavailable” or similar message, it will automatically be pulled out and customers should never see it.

1 comments
Hi, thank you for the article it is very useful. Where I can find more information that could help with custom monitors? I’m kinda noob with http and html.